Irrigation
Dal bilancio idrico al consiglio giornaliero: segui l’acqua disponibile nel terreno e traduci il fabbisogno della coltura in durata, volume totale, metri cubi per ettaro e litri per pianta, in base all’impianto utilizzato.
Bluleaf DSS
Bluleaf DSS enhances the work of agronomists and technical advisers throughout the crop cycle. The operational overview updates with data collected in the field, while agronomic algorithms help interpret it and assess crop needs.
The adviser and grower work from the same information, share assessments and follow decisions together, from planning through to checking operations. The agronomist can therefore provide timely guidance and continuous support for field activities.
Dal bilancio idrico al consiglio giornaliero: segui l’acqua disponibile nel terreno e traduci il fabbisogno della coltura in durata, volume totale, metri cubi per ettaro e litri per pianta, in base all’impianto utilizzato.
Dal fabbisogno al piano di concimazione: confronta i nutrienti richiesti dalla coltura con quelli già distribuiti e organizza prodotti, dosi e apporti nelle diverse fasi fenologiche.

Dal rischio alla pianificazione dei trattamenti: combina modelli previsionali e monitoraggi in campo, quindi verifica prodotti, etichette e disciplinari regionali con le informazioni disponibili in BDF.

Functionality
Over ten years, Bluleaf DSS has developed tools dedicated to understanding the crop cycle and managing operations. A body of experience that supports professionals in their work and in their dialogue with producers.
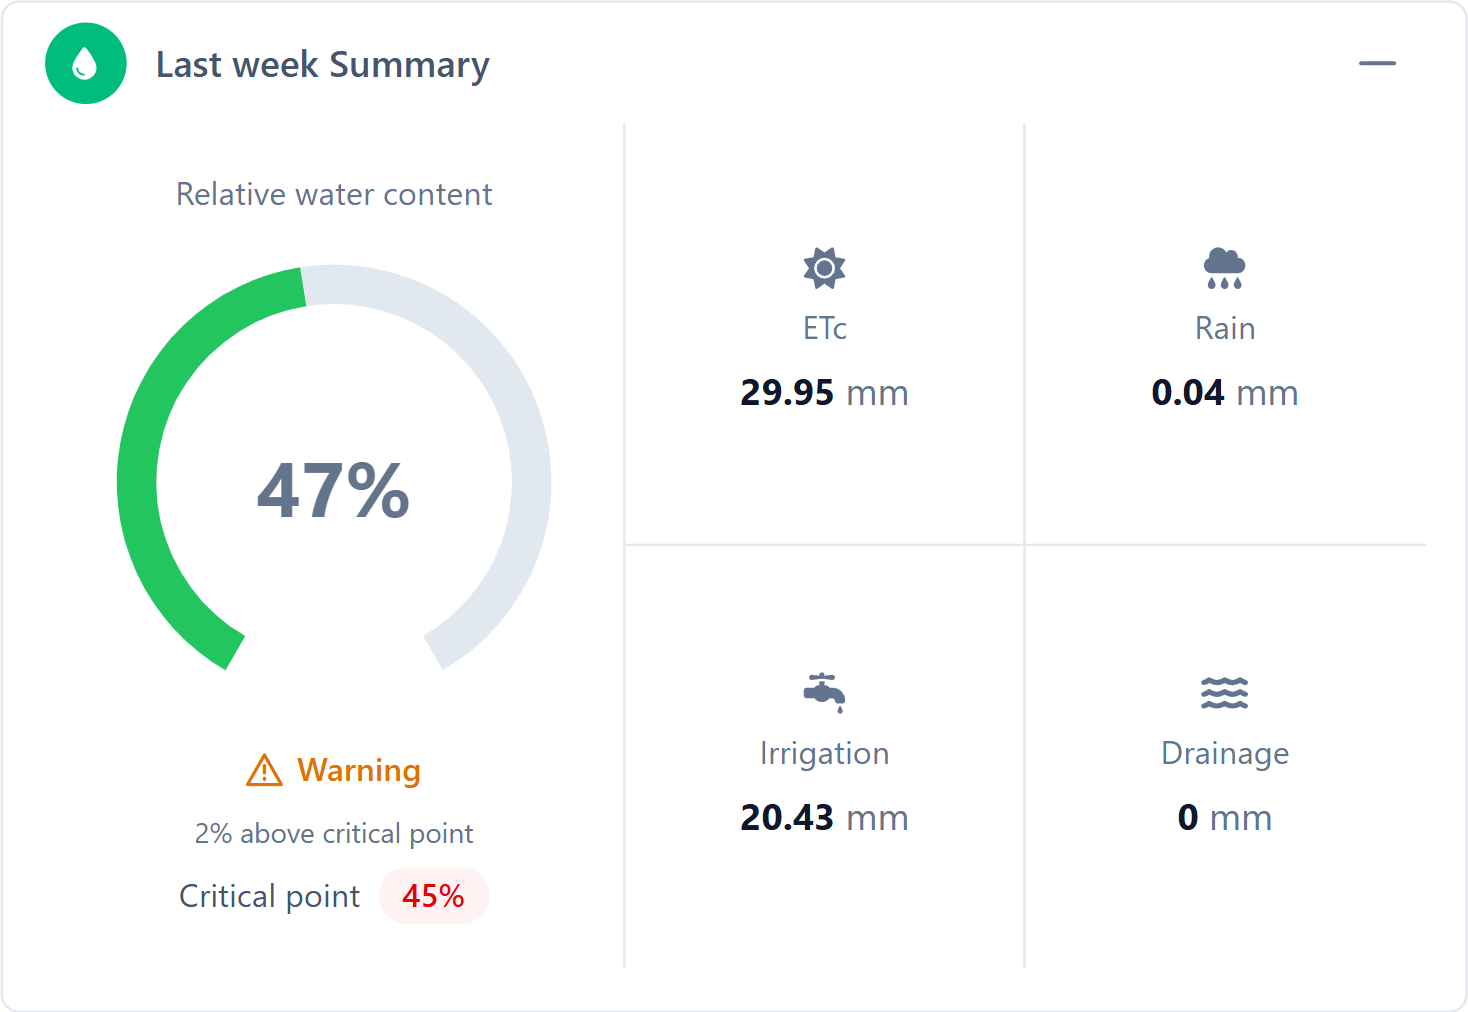
View crop water use, the water available in the soil, and trends in rainfall, irrigation and drainage.
Receive daily guidance expressed as duration, total volume, cubic metres per hectare and litres per plant.
Define the irrigation strategy for each phenological stage, including the permitted stress level and the percentage of the reserve to restore.
Compare the crop’s theoretical requirements with the inputs already applied for the main nutrients.
Distribute operations across the phenological stages and calculate the nutrients supplied by the selected fertilisers.
Organise treatments by pest or disease and phenological stage, keeping products, rates, water volumes and application methods visible.
View risk trends throughout the season and the details of the indicators for the selected day.
Record field observations and track the severity of pests and diseases and trap catches over time.
View fertilisers, plant protection products, compositions, labels and Italian regional production protocols for the main crops.
Configure the stages of the cycle and update them with observations made in the field.
View conditions during the cycle and compare model results with measurements collected in the field.
Observe vegetation index trends and variability within fields.
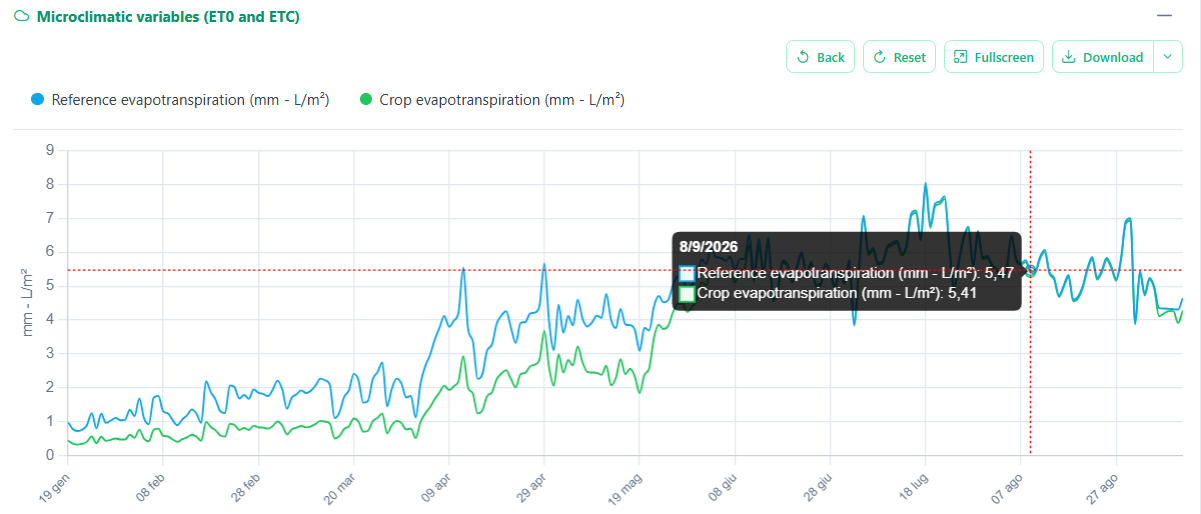
Bluleaf DSS uses separate models to estimate evapotranspiration, crop water use and changes in soil water.
The balance considers the soil water reserve, rainfall, recorded irrigation and drainage. Results can be compared with measurements from sensors connected to the crop cycle.
The requirement is then converted into a duration and volume for each configured irrigation system. If the unit has multiple systems, Bluleaf provides separate guidance consistent with the technical characteristics of each one.
The irrigation plan completes the picture by defining the permitted stress level and the amount of the reserve to restore during the different phenological stages.

View the water reserve, evapotranspiration and soil depletion level. Check rainfall, irrigation, drainage and the recent reserve status.
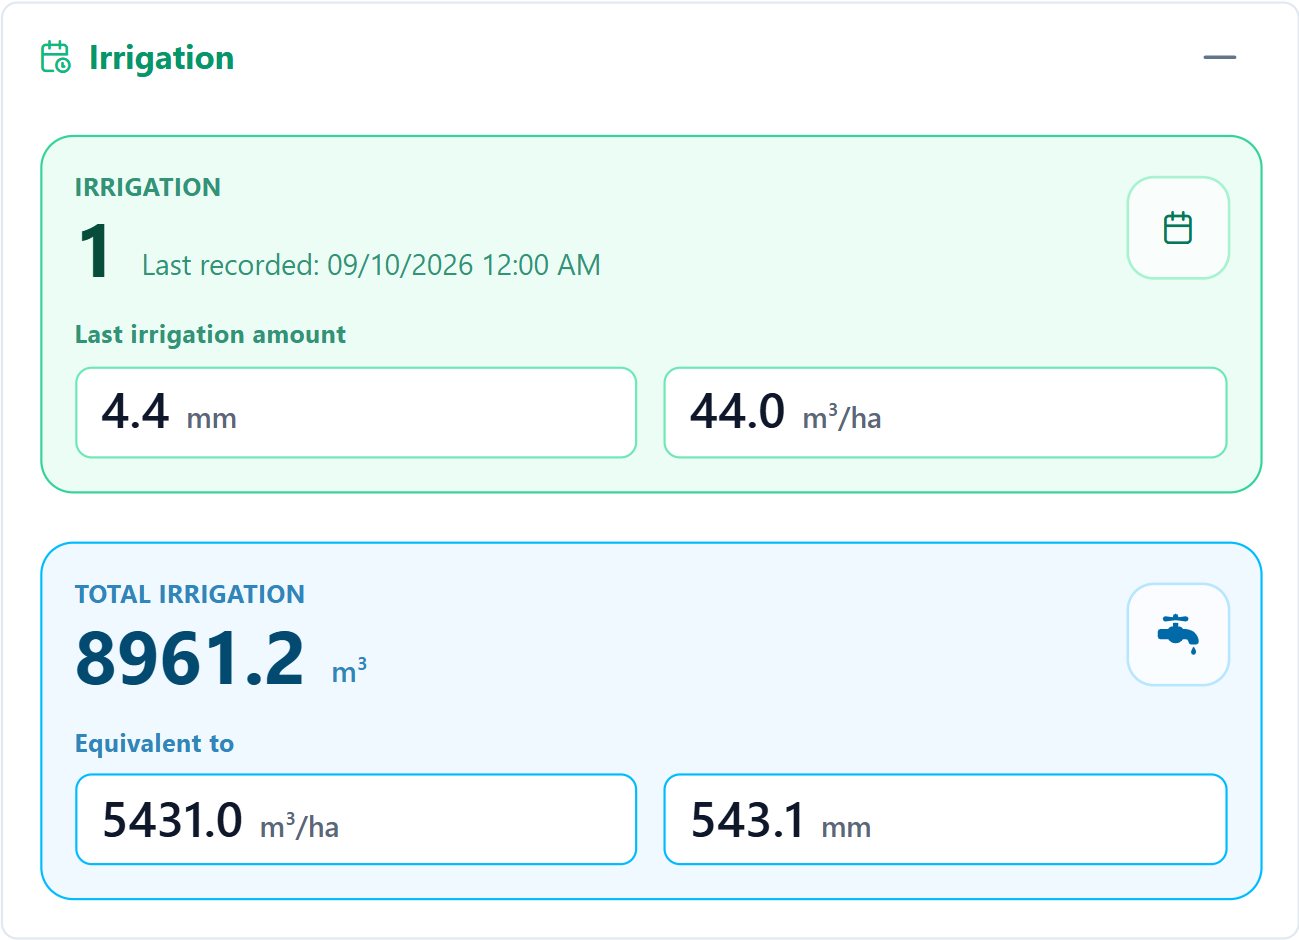
For each irrigation system, view the recommended duration and the volume of water to apply. Get guidance consistent with the characteristics of the irrigation system.
In the irrigation plan, you can configure water stress and the reserve to restore for each phenological stage. These settings guide the advice throughout the season.
You can automate irrigation and remotely manage the IoT devices connected to the irrigation system. Each completed operation is automatically recorded in the system.
Satellite imagery lets you view NDVI, NDRE and NDMI indices over time, together with RGB and SWIR views.
The nutrient balance shows how much nitrogen, phosphorus, potassium, calcium, magnesium and sulphur the crop requires and how much has already been applied.
In the fertilisation plan, operations are placed within the phenological stages and associated with the selected fertilisers. The composition stored in BDF is used to calculate the actual input of each nutrient, expressed in kilograms per hectare.
The comparison between theoretical requirements, planned quantities and completed inputs keeps the season’s nutrient picture up to date.

View the comparison between crop requirements and the inputs already applied. Check coverage for each phenological stage and use the chart to follow fertilisation trends.
In the plan, organise operations by phenological stage and associate products and rates. Bluleaf calculates inputs using BDF data, compares them with crop requirements and lets you record fertilisation in the digital field records.
View fertiliser composition and information on suitability for organic farming. For crop protection, find authorised uses, rates, pre-harvest intervals and checks based on the regional production protocols associated with the crop.
Predictive models show how risk develops during the season using data from the associated weather station.
Field observations and traps document the presence and severity of pests and diseases. The crop protection plan then organises treatments by phenological stage and provides the BDF information needed to select and use the product.
During planning, Bluleaf compares the rate, water volume, number of treatments and pre-harvest interval with the label and the applicable production protocol. Conditions that require attention remain visible before the treatment is recorded in the digital field records.

In the crop protection plan, associate pests and diseases with phenological stages and specify the product, rate and application method for each treatment. Bluleaf checks the information against the label and production protocol, highlighting the conditions to verify.
View monitoring, planned or completed treatments and the days since the last operation. Check the pre-harvest interval, the copper applied and the crop protection calendar across the phenological stages.
Record the pest or disease, affected organ, severity and trap catches, attaching photographs and documents. Follow monitoring trends in the charts and compare them with the configured thresholds.
Select the weather station, model and season to analyse. View the risk level, weather parameters, critical windows and any representation of them on the map.
Irrigation, fertilisation and treatments included in the plans can be converted into completed operations.
The information already in the plan is carried into the record and the activity becomes part of the crop cycle history. Balances and summaries can therefore take account of what was actually done in the field.
View crop conditions, plan irrigation, fertilisation and crop protection, and record operations in the digital field records.